The Apollo GTME Methodology
A seven-pillar operating system for building a self-optimizing AI-native go-to-market engine. Developed by Orchestra in partnership with Apollo.io.
Executive Summary
Most B2B revenue teams are adopting AI into a broken architecture — scattered lists, siloed campaigns, manual execution, and metrics that reset every quarter. The Apollo GTME Methodology is a seven-pillar operating system that replaces this with a continuous, self-optimizing go-to-market engine.
The core mechanics:
-
One unified market (Pillar 1) replaces fragmented list-building with a single AI-qualified TAM of 10,000-50,000 accounts
-
Infrastructure math (Pillar 2) derives exact mailbox and domain counts from market size — no guessing
-
Signal-based scoring (Pillar 3) replaces campaigns entirely — targeting logic is expressed as weighted signals, not time-boxed lists
-
AI-generated messaging (Pillar 4) assembles account-specific outreach from signal data, delivering 1:1 personalization at scale
-
Automated orchestration (Pillar 5) connects data sources, enrichment, and execution into a continuous pipeline
-
Human-in-the-loop review (Pillar 6) applies expert judgment to the top 10% of accounts while generating training data that improves the system
-
Signal-level reporting (Pillar 7) measures what predicts outcomes and feeds corrections back to every other pillar
The result: A GTM motion where institutional knowledge compounds instead of resetting — signal weights sharpen, messaging improves, the priority queue reshuffles itself, and every cycle gets more accurate than the last.
Developed by Orchestra GTM in partnership with Apollo.io. Built from real customer implementations, not theory.
The Problem Nobody Talks About
Every B2B revenue team is adopting AI. New tools, new workflows, new promises. And most of them are upgrading into chaos.
Here is what that looks like in practice: Marketing builds one list, Sales builds another, SDRs maintain a third, and an ops person stitches something together in a spreadsheet that nobody else trusts. Campaigns launch, run for six weeks, end, and all the learning dies with them. The next quarter starts from scratch.
One Apollo customer had over 4,000 separate lists in their account — four thousand — and nobody knew the total market size. New hires rebuilt lists from zero. Campaigns overlapped, contradicted each other, and produced metrics that couldn’t be compared across efforts because every list had different criteria, different enrichment, different scoring logic — or no scoring logic at all.
This is not a tooling problem. It is an architecture problem. And adding more AI to a broken architecture produces faster chaos.
AI without architecture is faster chaos.
The Apollo GTME Methodology is the architecture.
What This Methodology Actually Is
This is not a product tutorial. It is not a “best practices” guide that tells you to “write better subject lines” and “follow up consistently.”
This is a complete operating system for go-to-market — seven interconnected pillars that turn scattered, campaign-driven outreach into a continuous, self-improving engine built on one unified market, one scoring model, one messaging system, and one execution pipeline, all connected, all measured, and all feeding back into each other.
The methodology was built by Orchestra GTM in direct partnership with Apollo’s GTM Engineering team, refined across real customer implementations, and pressure-tested against the specific challenges that B2B revenue teams face when they try to scale outbound beyond “send more emails.”
The system runs continuously — no campaign start dates, no campaign end dates. Scores update dynamically, the queue reshuffles itself, messaging maintains full conversation history, and learning compounds instead of resetting.
You set the strategy, the system executes it, and you see everything.
Pillar 1: Build TAM List
 Source: Apollo · Built by Orchestra
TAM Unification — Your Entire Market Universe in One Place
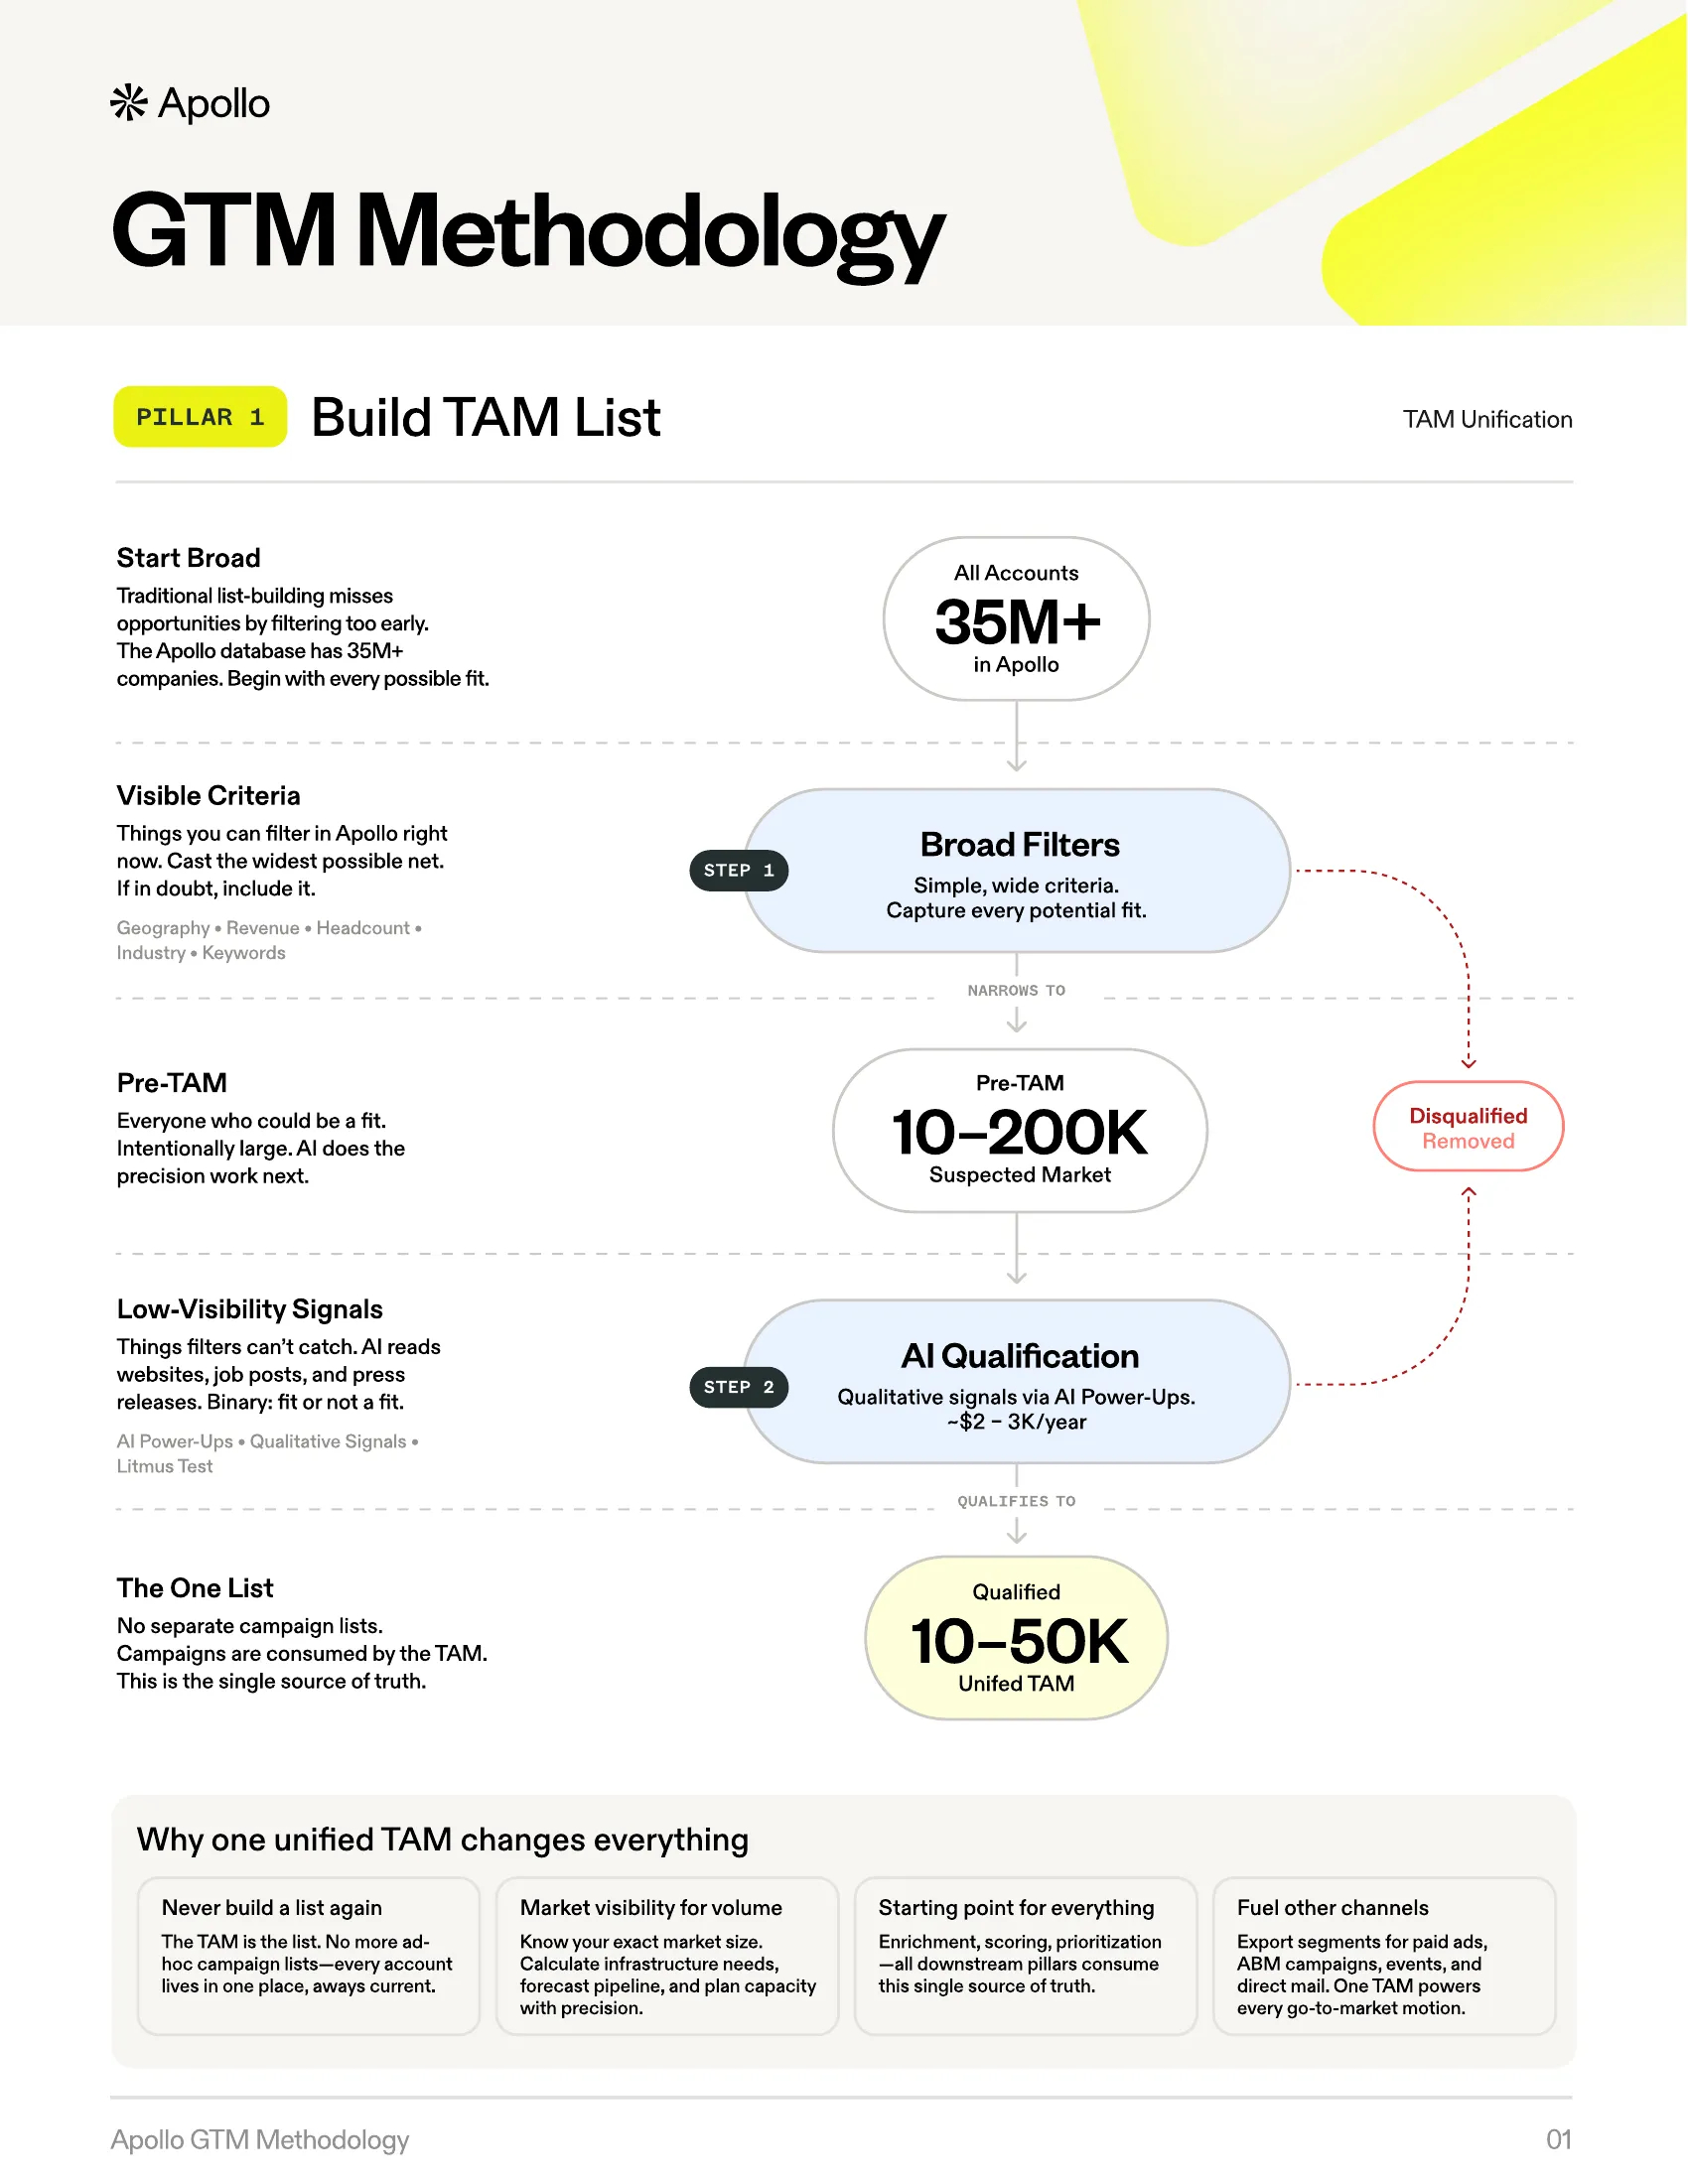
Traditional list-building misses opportunities by filtering too early. Teams apply narrow criteria — 50-200 employees, Series B, SaaS — and end up with a list of 3,000 accounts that represents a fraction of their actual market. Worse, every team member builds their own lists with their own criteria. Campaign lists pile up. Nobody knows the real market size. Every quarter is a fresh start from a blank search.
The result: incomplete coverage, no ability to compare accounts against each other, no single source of truth, and SDRs spending their mornings rebuilding lists that already exist somewhere else in the system.
The Method
The Apollo GTME Methodology replaces fragmented list-building with a two-step funnel that captures the complete addressable market, then qualifies it with AI.
Step 1: Cast a Wide Net (Suspected Market)
Start with intentionally broad filters. Geography, high-level industry keywords, basic headcount ranges. The goal is not precision — it is capture.
Apollo’s database covers millions of companies globally. Use simple, visible criteria to pull a suspected market of 50,000 to 250,000 accounts. This list will contain significant noise. That is by design.
The criteria used at this stage are what the methodology calls high-visibility criteria — attributes that exist as structured fields in a database: employee count, revenue, industry, and location. These are things you can filter on directly.
Step 2: AI Qualification (Qualified TAM)
Deploy an AI qualification prompt across the entire suspected market. This handles what database filters cannot: low-visibility criteria.
These are qualitative attributes — “creates original technology,” “recently expanded into a new vertical,” “has a consultative sales motion” — that require reading websites, job postings, press releases, and product pages to evaluate.
The AI reads each company and makes a binary decision: fit or not a fit.
The output is a Qualified TAM — typically 10,000 to 50,000 accounts, depending on market specificity. This is the single, comprehensive master list that all other GTM activities reference.
Why This Changes Everything
Campaigns are consumed by signals. This is the critical conceptual shift. There are no separate campaign lists. Instead of creating a “March healthcare push,” the “Industry: Healthcare” signal is assigned a higher scoring weight in Pillar 3. Those accounts naturally rise to the top of the priority queue.
Inbound becomes one more signal. An inbound lead’s “inbound” status becomes a data point (
is_inbound = true) weighed alongside every other signal. A high-fit outbound account can outrank a low-fit inbound lead. The methodology calls this All-Bound — inbound and outbound evaluated on the same playing field.
The TAM becomes the single source of truth. Scoring (Pillar 3), messaging (Pillar 4), infrastructure sizing (Pillar 2), and reporting (Pillar 7) all reference the same list — one market and one model governing all GTM activity.
From Account TAM to Contact TAM
The qualified account list is not the final destination. People buy, not companies. The methodology converts the Account TAM into a Contact TAM using a sampling method: run contact searches on a representative slice of accounts, identify the right personas per account (typically 2-5 contacts depending on deal complexity), calculate the ratio, and project across the full TAM. This Contact TAM — the actual humans who will receive outreach — is what feeds into Pillar 2’s infrastructure math and Pillar 4’s messaging engine.
The Delete Button
Building the TAM is an act of addition and subtraction. The qualification prompt’s “not a fit” verdicts are as valuable as its approvals. Removing 150,000 accounts from a suspected market of 200,000 is not waste — it is precision. Every account removed is budget not spent on irrelevant outreach, infrastructure not provisioned for contacts who would never convert, and signal noise eliminated from the scoring model. The delete button is a strategic instrument.
Practical Details
| Parameter | Value |
|---|---|
| Cost | Approximately $2-3K in AI credits for 50,000 accounts |
| Frequency | Once a year (or quarterly for fast-moving markets) |
| Validation | Run the qualification prompt on a sample of 500 accounts first. Calculate the pass rate. Extrapolate TAM size and credit cost. |
| Segmentation | Segment by use-case (“Rip & Replace Competitor,” “PLG Expansion”) rather than demographics. Apply the MECE principle — Mutually Exclusive, Collectively Exhaustive. |
Pillar 2: Deliverability & Burn Rate
 Source: Apollo · Built by Orchestra
Infrastructure Math — From TAM to Mailboxes
Most teams guess at outreach volume. “Ten mailboxes sounds right.” “Let’s start with 5,000 emails a month and see what happens.” This leads to two failure modes that both damage the business:
Burning too fast: Exhausting the entire market in two to three months, at which point audience fatigue sets in and reply rates collapse.
Being too timid: Reaching a fraction of the addressable market. Thousands of qualified accounts never receive a single touch.
Both failures share the same root cause: no mathematical relationship between market size and outreach infrastructure.
The Method
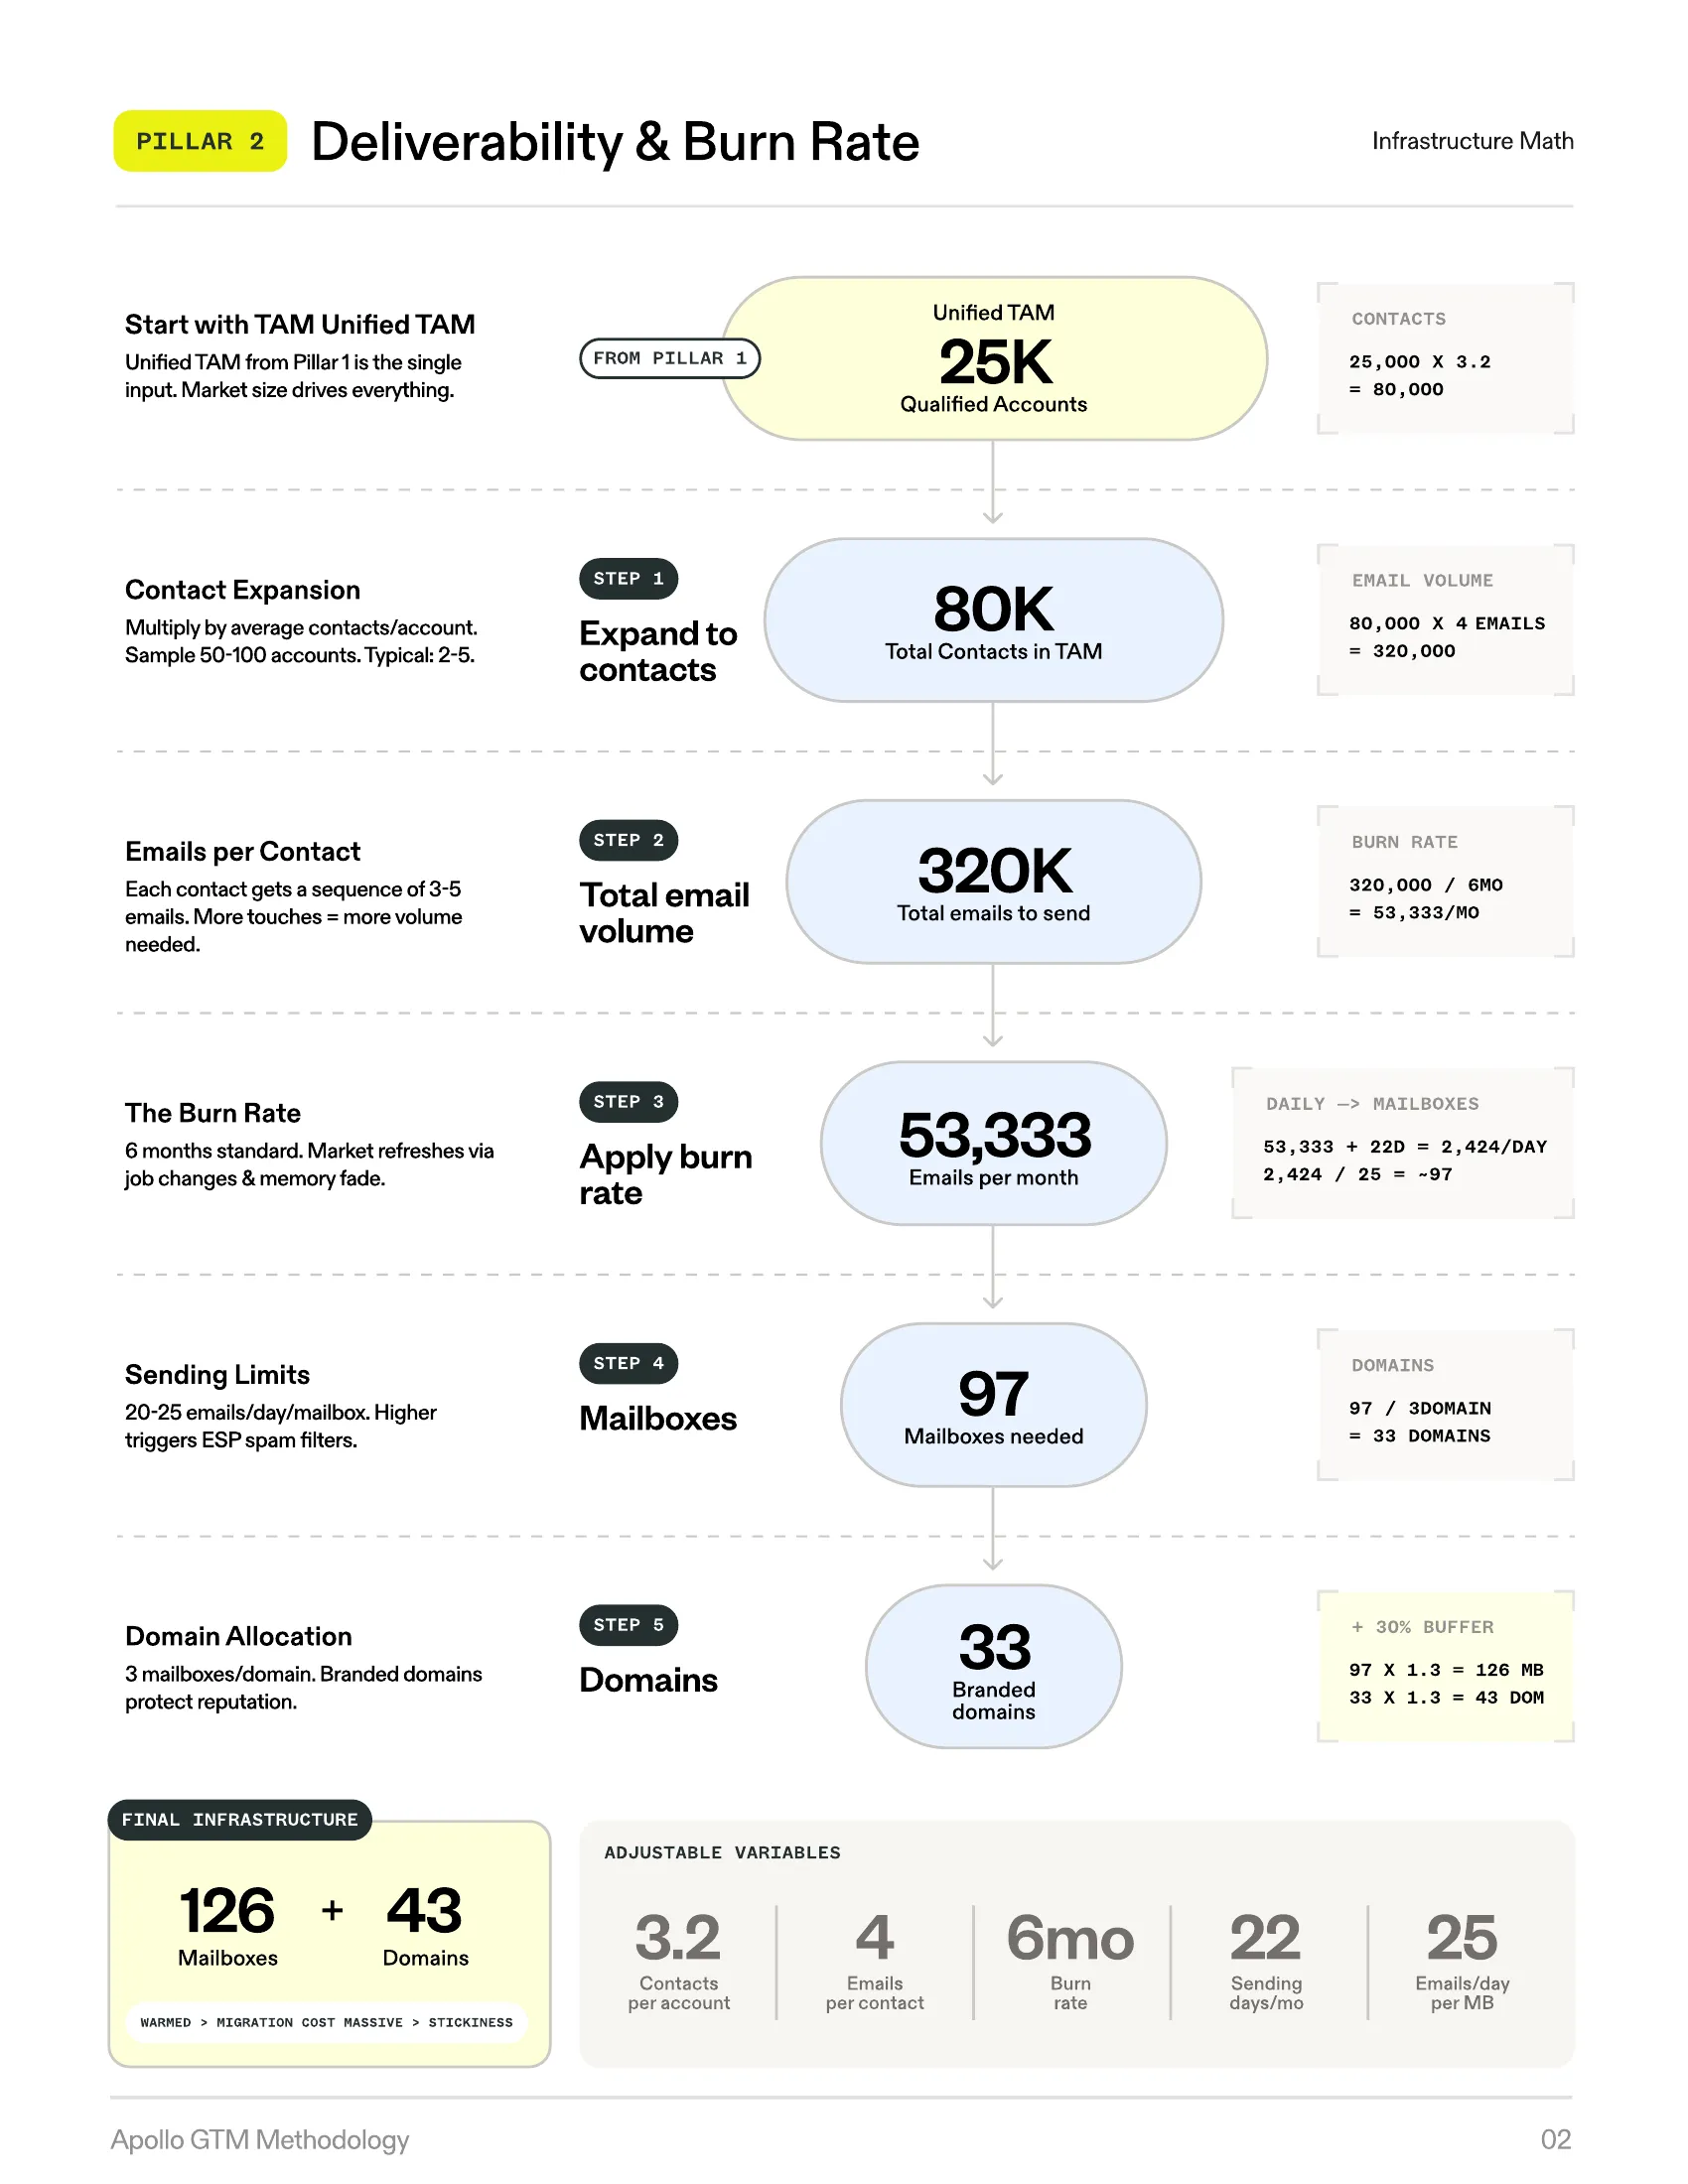
The methodology introduces burn rate — the pace at which you contact your entire TAM — as the governing constraint for all infrastructure decisions.
The standard recommendation is a 6-month burn rate. At this cadence, every contact in your TAM receives outreach within six months.
This specific timeframe is grounded in three realities:
-
Approximately 20% annual job turnover creates natural market refresh
-
Contact memory of previous outreach fades within 4-6 months
-
Six months provides enough time for multi-touch sequences to complete without overlap
The burn rate is adjustable. Three months is aggressive (high-velocity sales, transactional products). Twelve months is conservative (enterprise, complex sales, small TAM). Six months is the baseline.
The Backward Calculator
Once you have a TAM (Pillar 1) and a burn rate, every other infrastructure number falls out of a formula — no guessing required. You work backward from your qualified TAM through five steps — expanding to contacts, calculating total email volume, applying the burn rate, sizing mailboxes, and allocating domains — until you arrive at exact infrastructure requirements.
Adjustable Variables
| Variable | Range | Notes |
|---|---|---|
| Contacts per account | 2-5 | Depends on deal complexity |
| Emails per contact | 3-6 | Per sequence |
| Burn rate months | 3-12 | Governs pace |
| Emails per mailbox per day | 20-30 | Constrained by ESP algorithms |
| Mailboxes per domain | 2-3 | Reputation management |
Pillar 3: Scoring & Prioritization
 Source: Apollo · Built by Orchestra
Signal-Based Scoring — Your Priorities Turned Into Math
Teams build campaigns around a single signal. “Launch a healthcare campaign.” “Target companies that just raised funding.” They miss good companies that match on signals they are not tracking, and they include bad companies that happen to match the one signal they picked. Scoring, when it exists, lives in someone’s head. It is not documented, not systematic, and not reproducible.
The Method
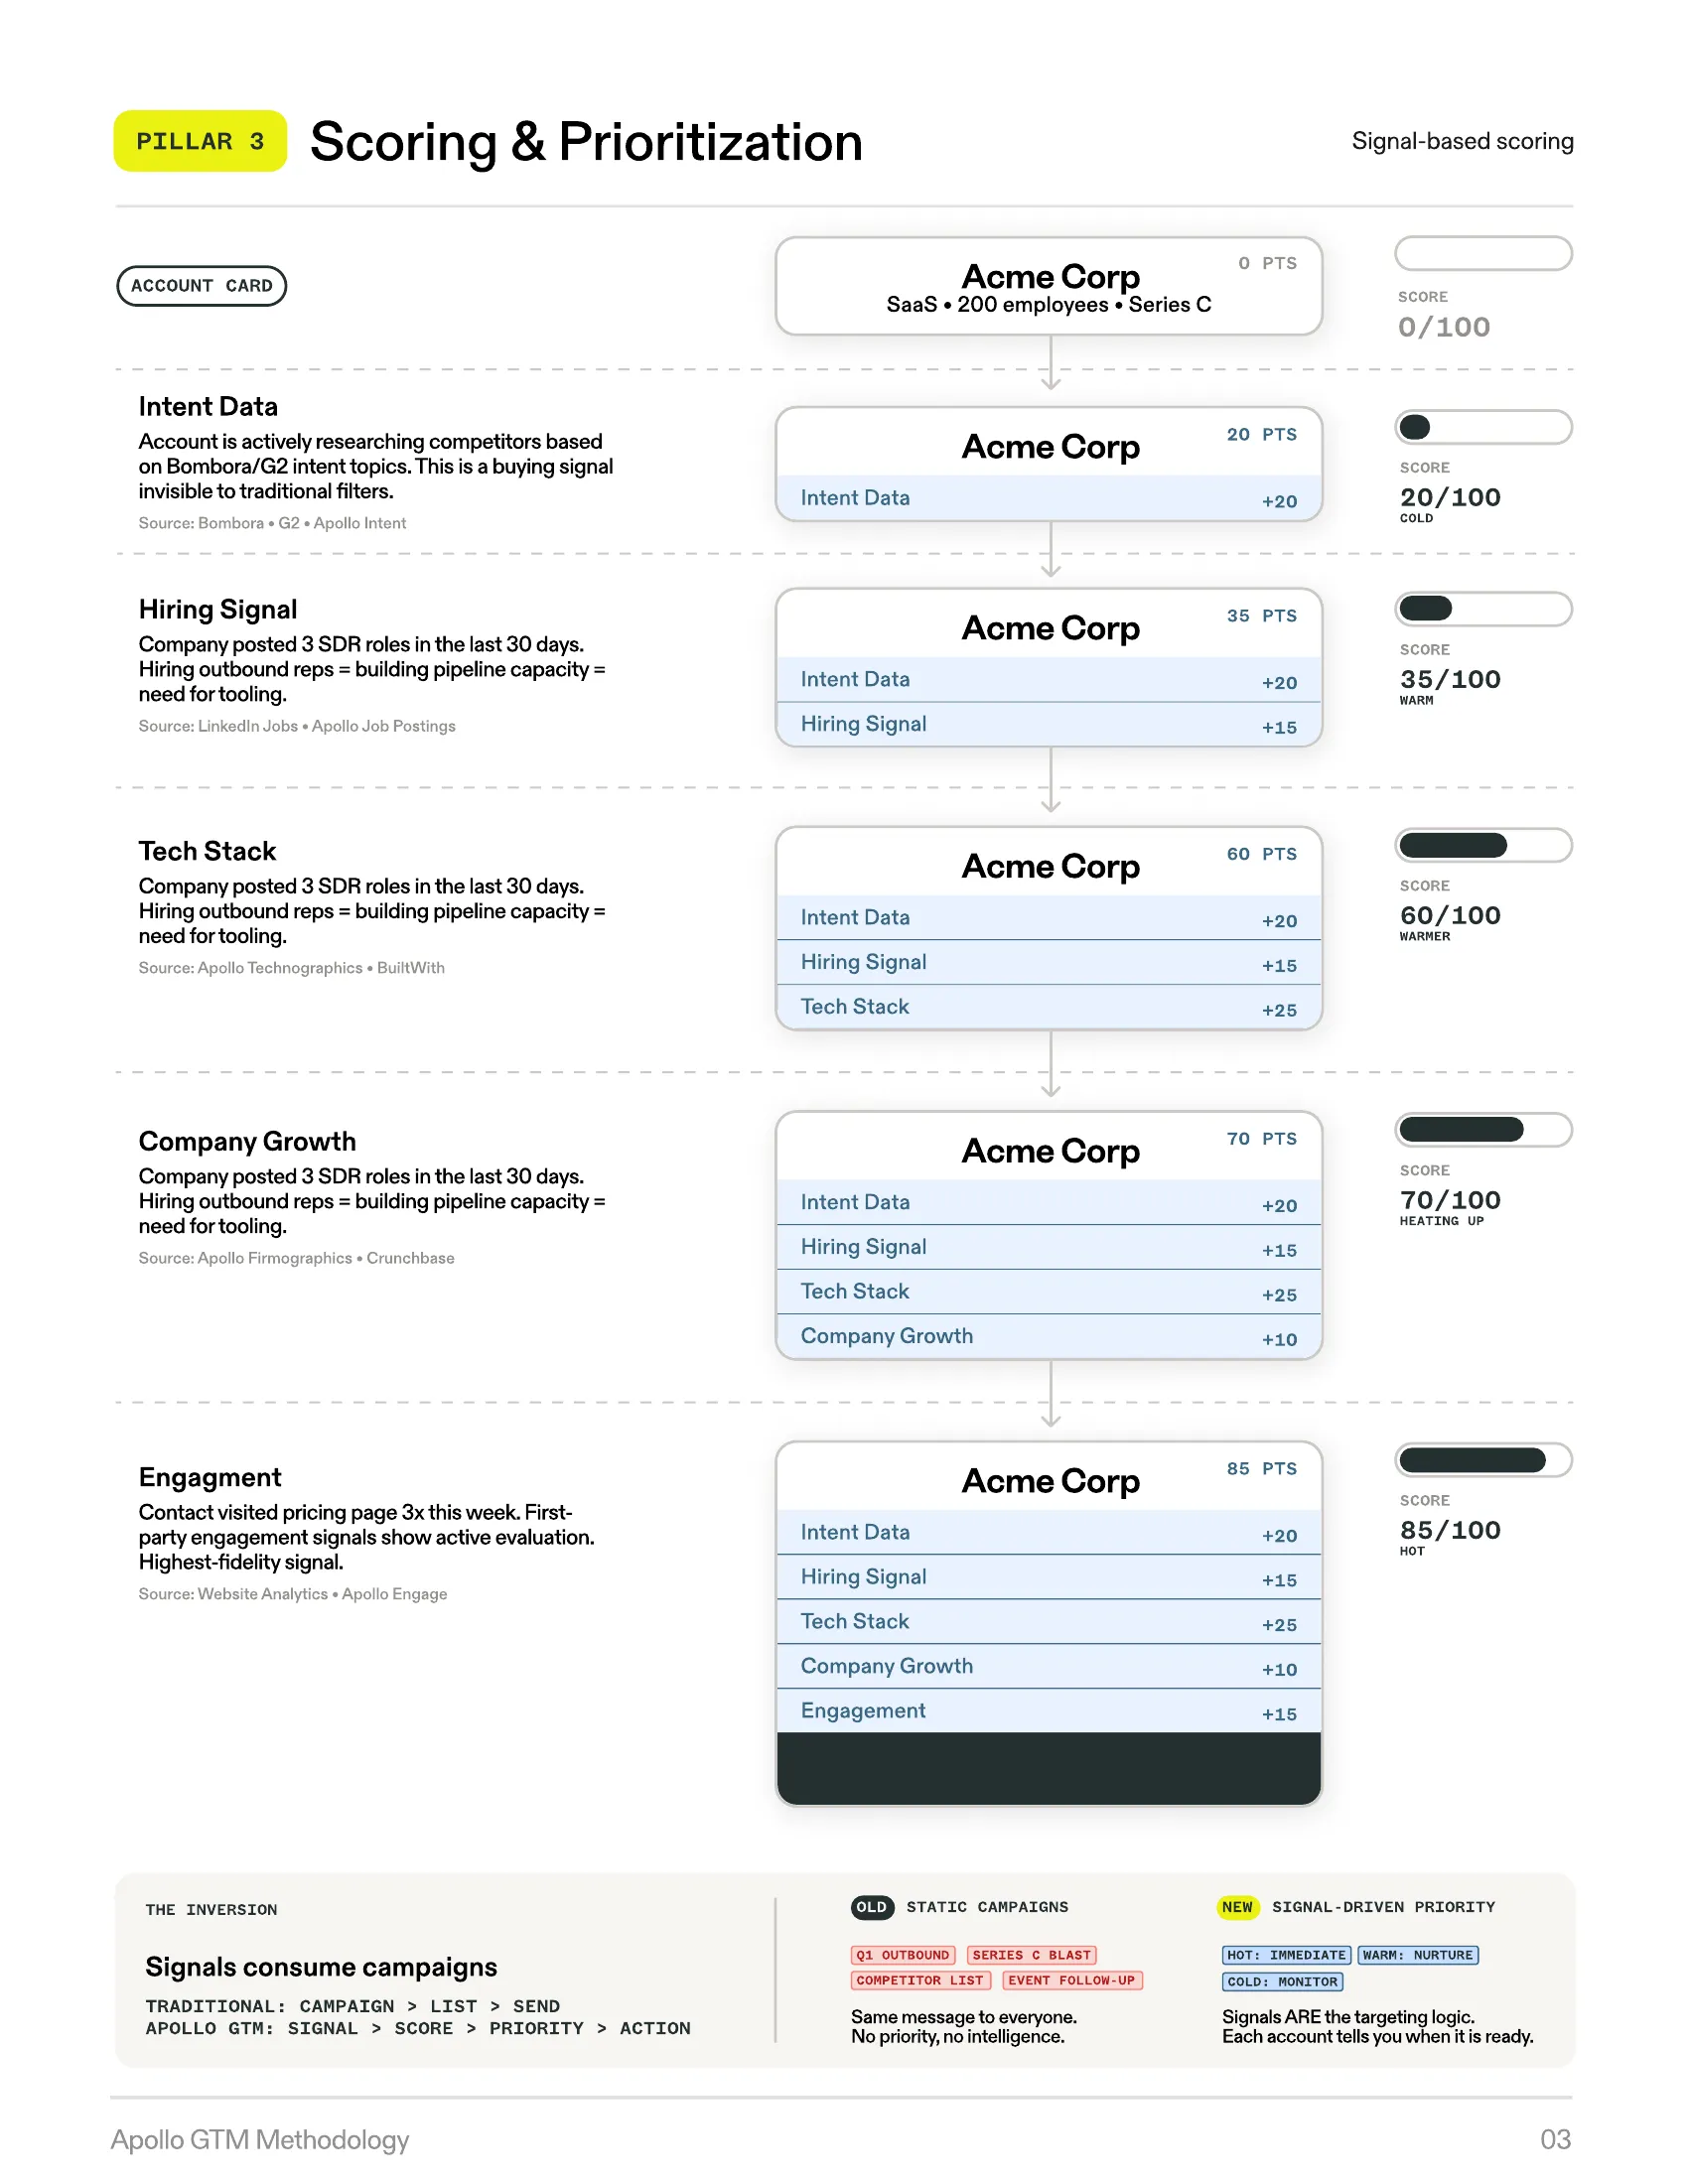
The methodology replaces campaign-driven targeting with signal-based scoring — a systematic framework where every account in the TAM is evaluated against the same set of signals, weighted by importance, and ranked on a single composite score.
A signal is a question you want to ask about an account or contact that can influence scoring, messaging, or both.
The Signal Table
This is the central planning artifact. Before any technical implementation, leadership builds a signal table — a strategic document that forces alignment on what matters and how much.
| Signal Name | Type | Source | Weight | Outcomes | Score Impact |
|---|---|---|---|---|---|
| Uses competitor tool | Scoring + Messaging | Apollo Technographics | 20 | Outreach/SalesLoft/ZoomInfo/None | 20/15/15/0 |
| Recent funding | Scoring | Apollo | 15 | Series A/B/C/None | 10/15/15/0 |
| Hiring for SDR roles | Scoring + Messaging | LinkedIn Jobs | 15 | 1-3 roles/4-10/10+/None | 10/15/15/0 |
| Website visitor (pricing) | Scoring | 1st-party data | 10 | Yes/No | 10/0 |
| Industry healthcare | Scoring | Apollo | 10 | Yes/No | 10/0 |
Weights are distributed across 100 total points, so every account receives a composite score and the queue self-orders accordingly.
How Signals Accumulate Into a Score
Each signal adds points incrementally. As research completes — intent data surfaces, a hiring signal fires, technographic data populates, company growth is measured, engagement activity registers — the account’s score builds toward a composite number that represents total fit and timing.
Rows and Columns — The Core Framework
The signal table starts as a planning document where rows are signals and columns describe each signal’s attributes. This is the strategic artifact.
The critical move is “the inversion”: each signal row in the planning table becomes a column in the live operational account table. The strategic document becomes the execution infrastructure — no translation layer, no handoff, and no gap between the plan and the system.
Signals are classified into two types:
-
Fit signals (static): Fundamental alignment with the ideal customer profile. Company size, industry, tech stack. Relatively stable over time.
-
Timing signals (dynamic): Immediate opportunity. Recent funding, job postings, website visits, intent data. These change frequently and create the “why now” urgency.
Three-Layer Scoring Architecture
| Layer | Description | Behavior |
|---|---|---|
| Layer 1 | Account Score | Derived from the signal table. Relatively stable, recalculated when signals refresh. |
| Layer 2 | Contact Multiplier | Role-based adjustment. VP of Sales gets a higher multiplier than a junior SDR. |
| Layer 3 | Dynamic Engagement Factors | Recency decay + saturation cap. Creates the self-reshuffling queue. |
Final Contact Score = Account Score × Contact Multiplier × Recency Factor × Saturation Factor
Signals Consume Campaigns
“Launch healthcare campaign” becomes “increase Healthcare Industry weight from 10 to 40 for the next quarter.” The accounts surface naturally. The scoring model IS the campaign strategy, expressed as math instead of ad-hoc lists.
Pillar 4: Messaging Intelligence
 Source: Apollo · Built by Orchestra
Research-Based, Account-Specific Messaging at Scale
Generic templates get ignored. Everyone can spot a merge-tag email. But manual personalization — the kind where a rep spends 20 minutes researching a company and writing a custom message — does not scale past a handful of accounts per day.
Most teams face a binary choice: quality or quantity. The Apollo GTME Methodology eliminates that tradeoff.
The Method
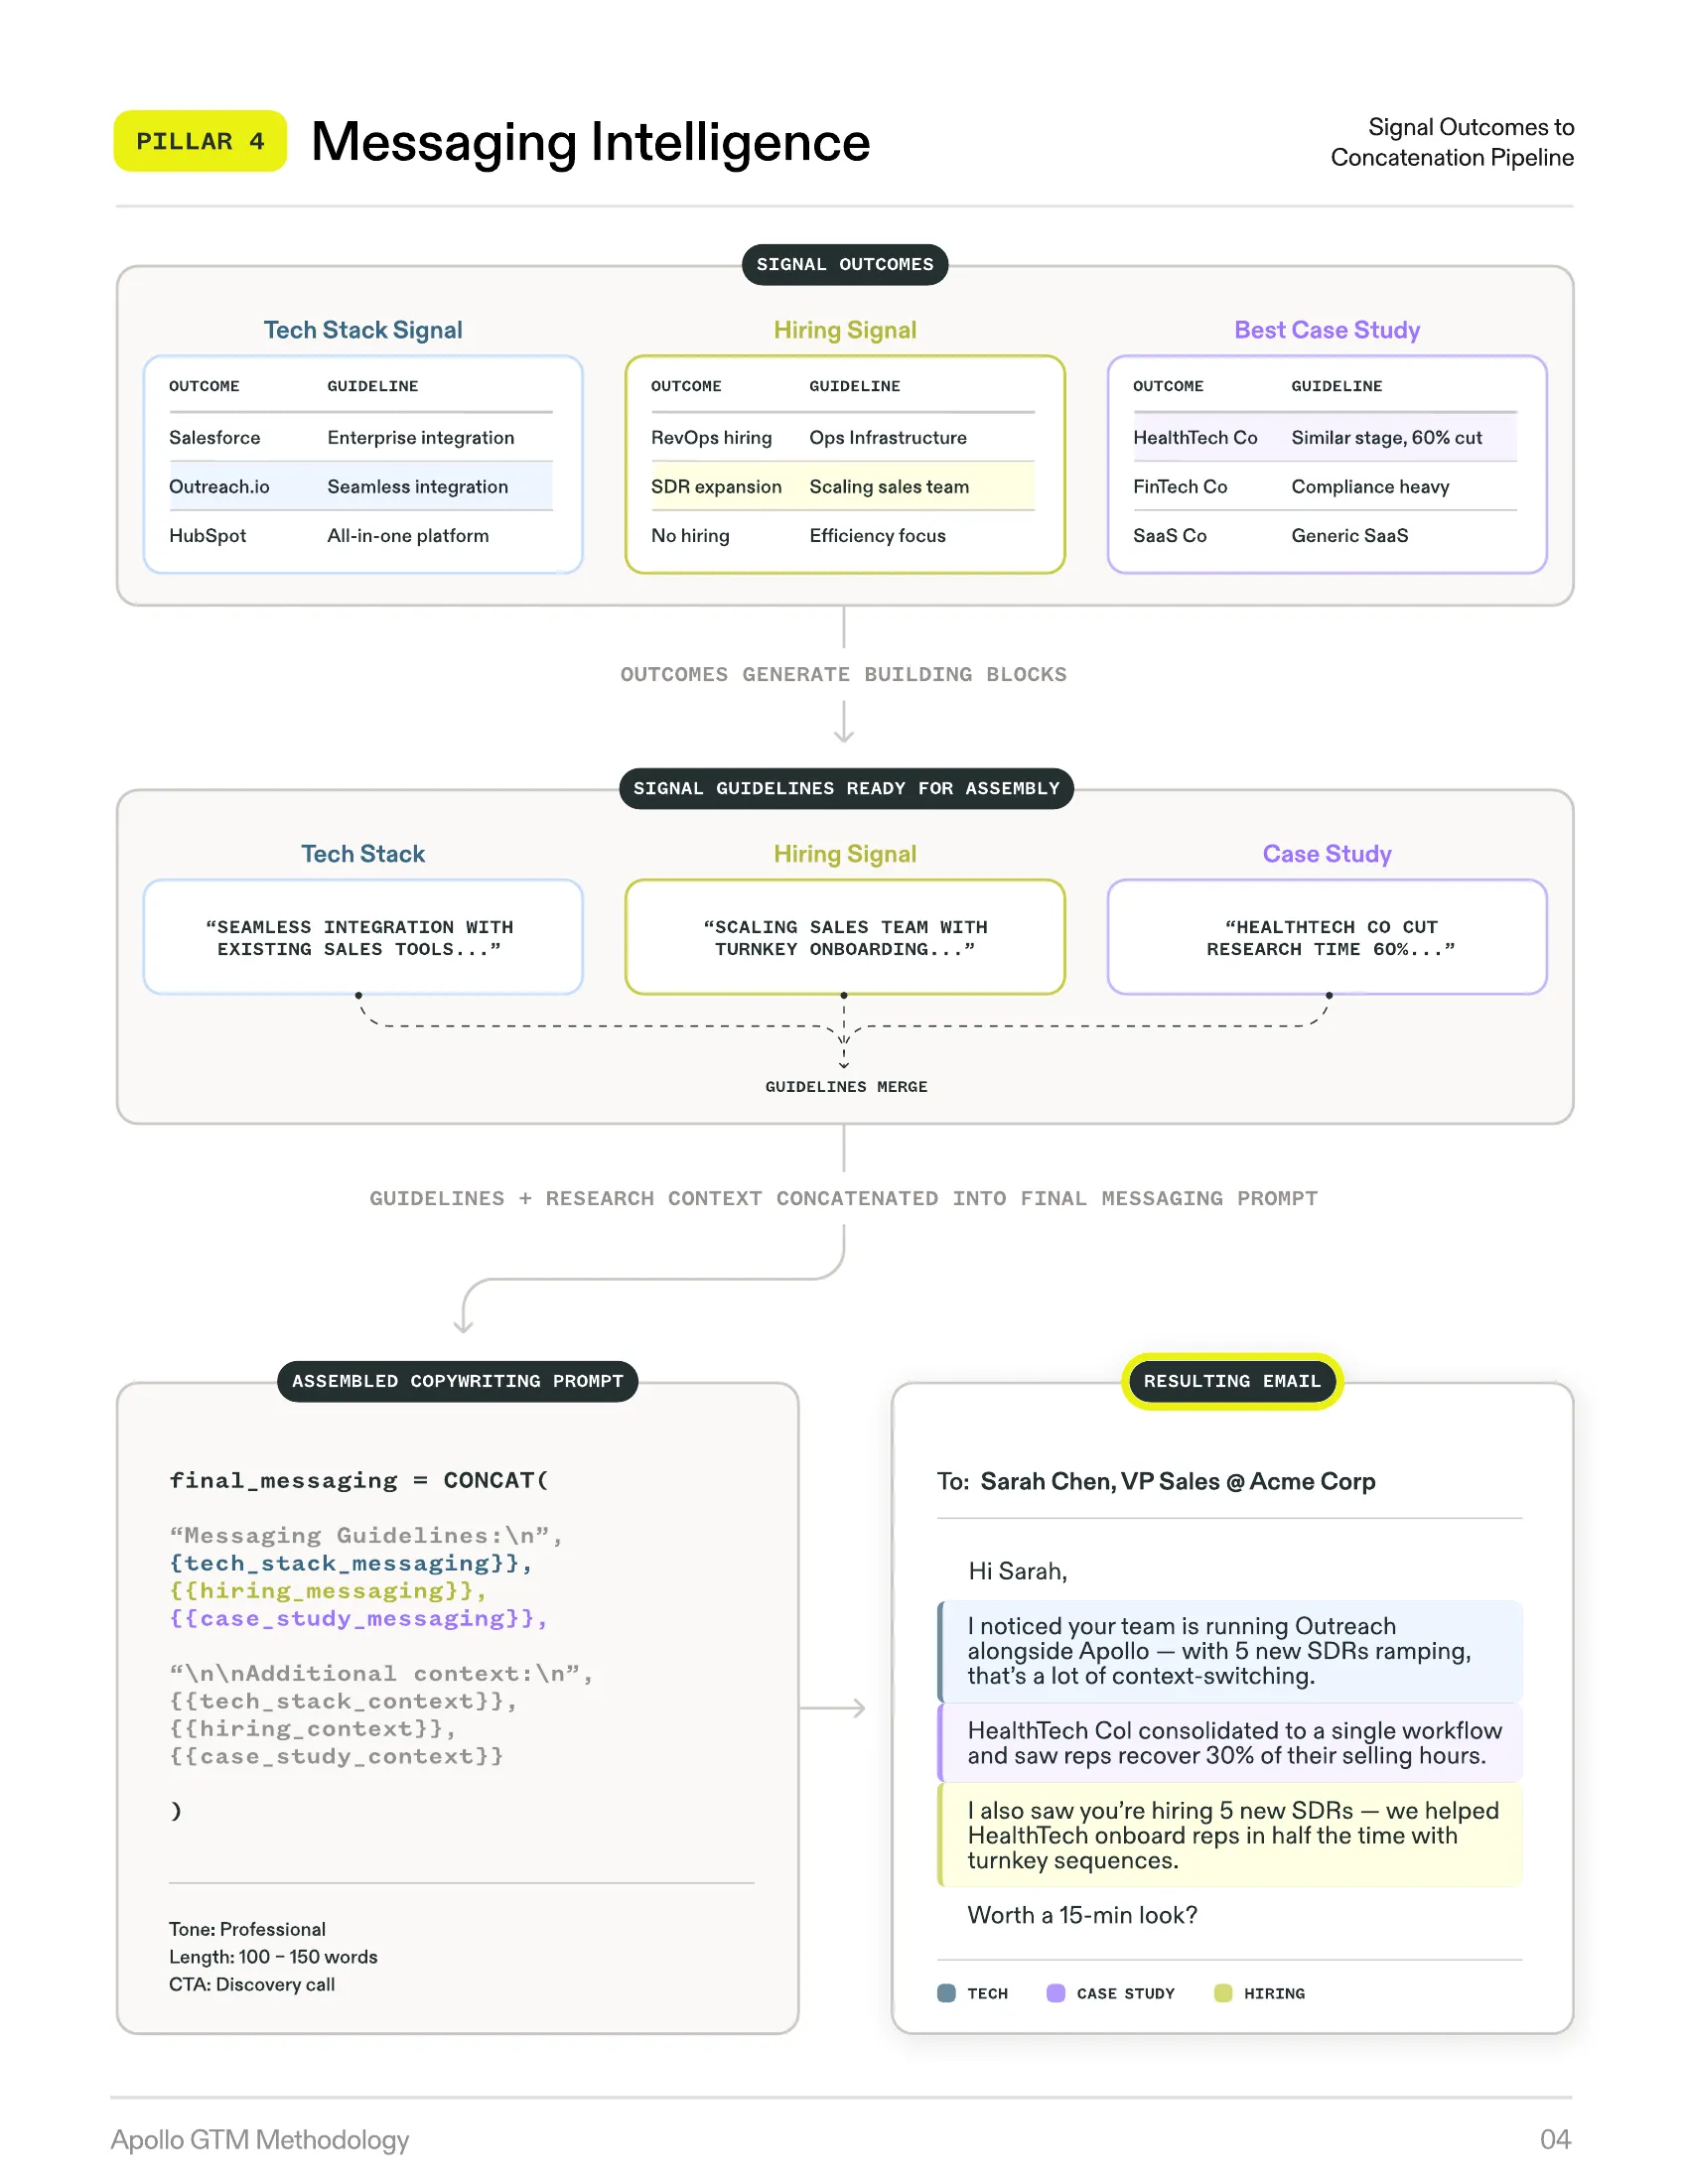
Messaging intelligence uses the same signal architecture from Pillar 3, but instead of generating a score, each signal generates messaging guidelines — modular building blocks the methodology calls Lego blocks.
| Signal | Outcome | Messaging Guideline |
|---|---|---|
| Tech Stack | Uses Outreach.io | ”Reference integration with existing sales tools. Emphasize consolidation opportunity.” |
| Hiring Signal | Posting 5+ SDR roles | ”Acknowledge scaling sales team. Position around onboarding speed and team-wide consistency.” |
| Best Case Study Match | [Matched case study] | “Reference matched case study results. Position around similar company profile and shared challenges.” |
The Pipeline: Guidelines → Prompt → Message
-
Step 1: Signal outcomes generate guidelines (Lego blocks)
-
Step 2: Guidelines merge into a prompt — different for every account because the signal combination is different
-
Step 3: AI generates the final message — draws from multiple data points, reads as genuinely personalized, maintains brand consistency
Mini-Matrices for Persona Variation
The same signal produces different messaging for different personas. A “Competitive Tool Detected” signal generates:
-
For a CFO: Cost savings, ROI consolidation, vendor reduction
-
For a VP of Sales: Team productivity, pipeline velocity, adoption speed
-
For a Head of Ops: Integration simplicity, workflow consolidation, admin overhead reduction
Thread-Aware Messaging
Every outreach prompt receives the complete conversation history. Previous touches, dates, messages sent, responses received, current signal state. The AI builds on the existing thread. It never repeats a hook. It references previous context naturally.
Cost Architecture
| Tier | Scope | Cost |
|---|---|---|
| Account-level research | Heavy — done once per account | Credit-intensive: AI reads company, generates core signal outcomes and messaging guidelines |
| Contact-level adaptation | Light — done per contact | Fraction of cost: “Take this account message and adjust for [VP Sales persona]“ |
Pillar 5: Data Orchestration & Workflows
 Source: Apollo · Built by Orchestra
All Sources, One System — From Strategy to Evergreen Execution
Signals come from everywhere. First-party sources — your CRM, your website, your product analytics. Second-party sources — Apollo’s database, intent data. Third-party sources — API providers, web scraping, industry databases. These sources need to connect, process, and feed into the same story.
The Method
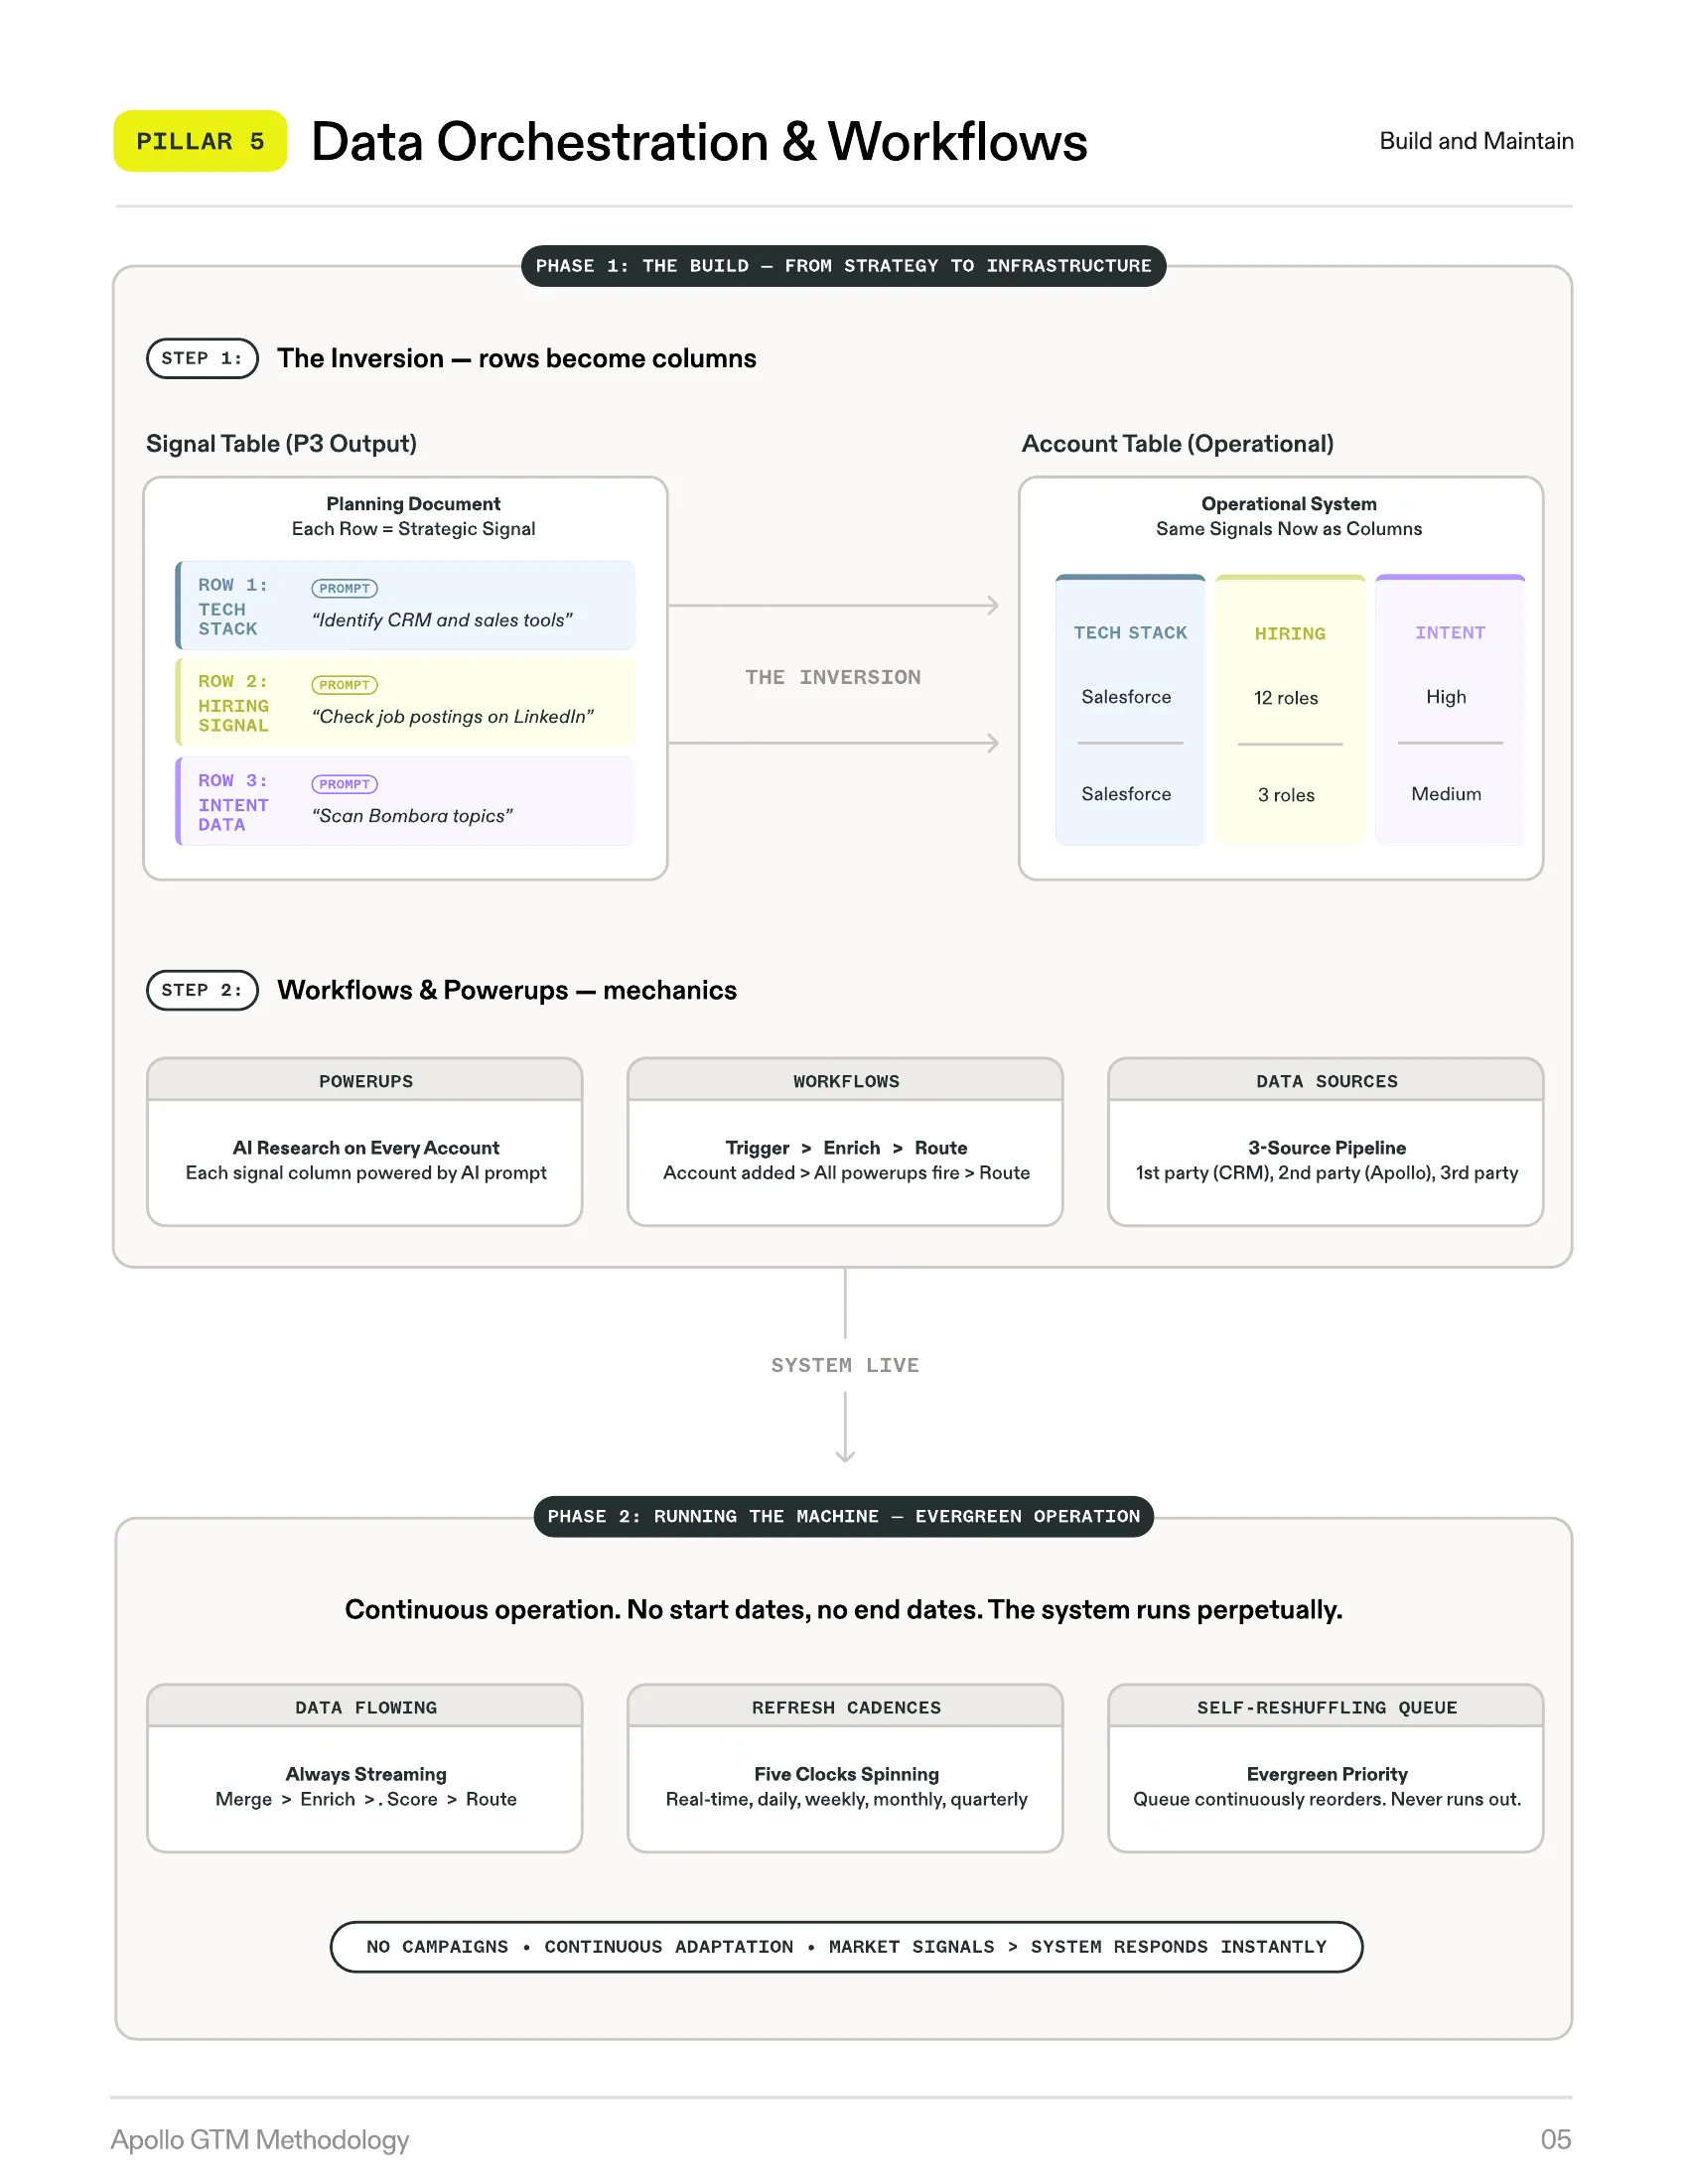
Pillar 5 is the operational backbone — the infrastructure that connects the signal table (Pillar 3), messaging architecture (Pillar 4), and execution into a continuous, automated pipeline. It operates in two distinct phases.
Phase 1 turns strategy into infrastructure. The signal table rows become operational columns. Phase 2 is evergreen operation — the machine runs continuously with no start dates, no end dates, and a self-reshuffling priority queue.
The Inversion in Practice
The signal table (rows of signals) becomes the column structure of the operational account table. Each signal gets:
-
A data source (where the answer comes from)
-
A prompt or formula (how to get the answer)
-
A refresh cadence (how often to re-ask the question)
-
An output format (structured categories, not free text)
Agentic Research
For signals that require deeper investigation, the methodology employs multi-step AI research chains:
-
Linear chains: Prompt 1 does broad research, identifies gaps, and generates a focused follow-up prompt, with each step going deeper.
-
Parallel agents: A master prompt spawns multiple research agents exploring different facets simultaneously — competitive landscape, hiring trends, technology stack — then consolidates findings.
The Self-Reshuffling Queue
Every contact has a composite score (from Pillar 3). Scores recalculate continuously as signals refresh, the queue reorders automatically, and execution pulls from the top each cycle without manual intervention.
Contacts never “run out.” After outreach, their recency factor decays over time. Eventually they become contactable again.
The 90/10 Split
| Segment | Path | Action |
|---|---|---|
| Bottom 90% | Fully automated | Sequences execute without human intervention |
| Top 10% | Human review | Routed to HITL interface before sending (Pillar 6) |
Customer Sophistication Levels
| Level | Description | Tools |
|---|---|---|
| 0 | Basic list building, no AI | Manual prospecting |
| 1 | Apollo data + AI Power-Ups | Apollo native |
| 2 | Apollo → Clay → Apollo hybrid | Apollo + Clay |
| 3 | Clay for origination + deep scraping | Clay-primary |
| 4 | Custom backends, APIs, Apollo as bookends | Snowflake/Supabase + Apollo |
Pillar 6: Human in the Loop
 Source: Apollo · Built by Orchestra
AI Speed With Human Judgment
Two opposing fears paralyze most teams:
Fear of full automation: “What if the AI sends something embarrassing to our biggest prospect?” AI-generated content hallucinates — it gets facts wrong and misreads tone.
Fear of full manual review: “If we have to review every message, what’s the point of automation?” Requiring human approval on every email eliminates the efficiency gains entirely.
The methodology resolves this with a precise, score-based triage system.
The Method
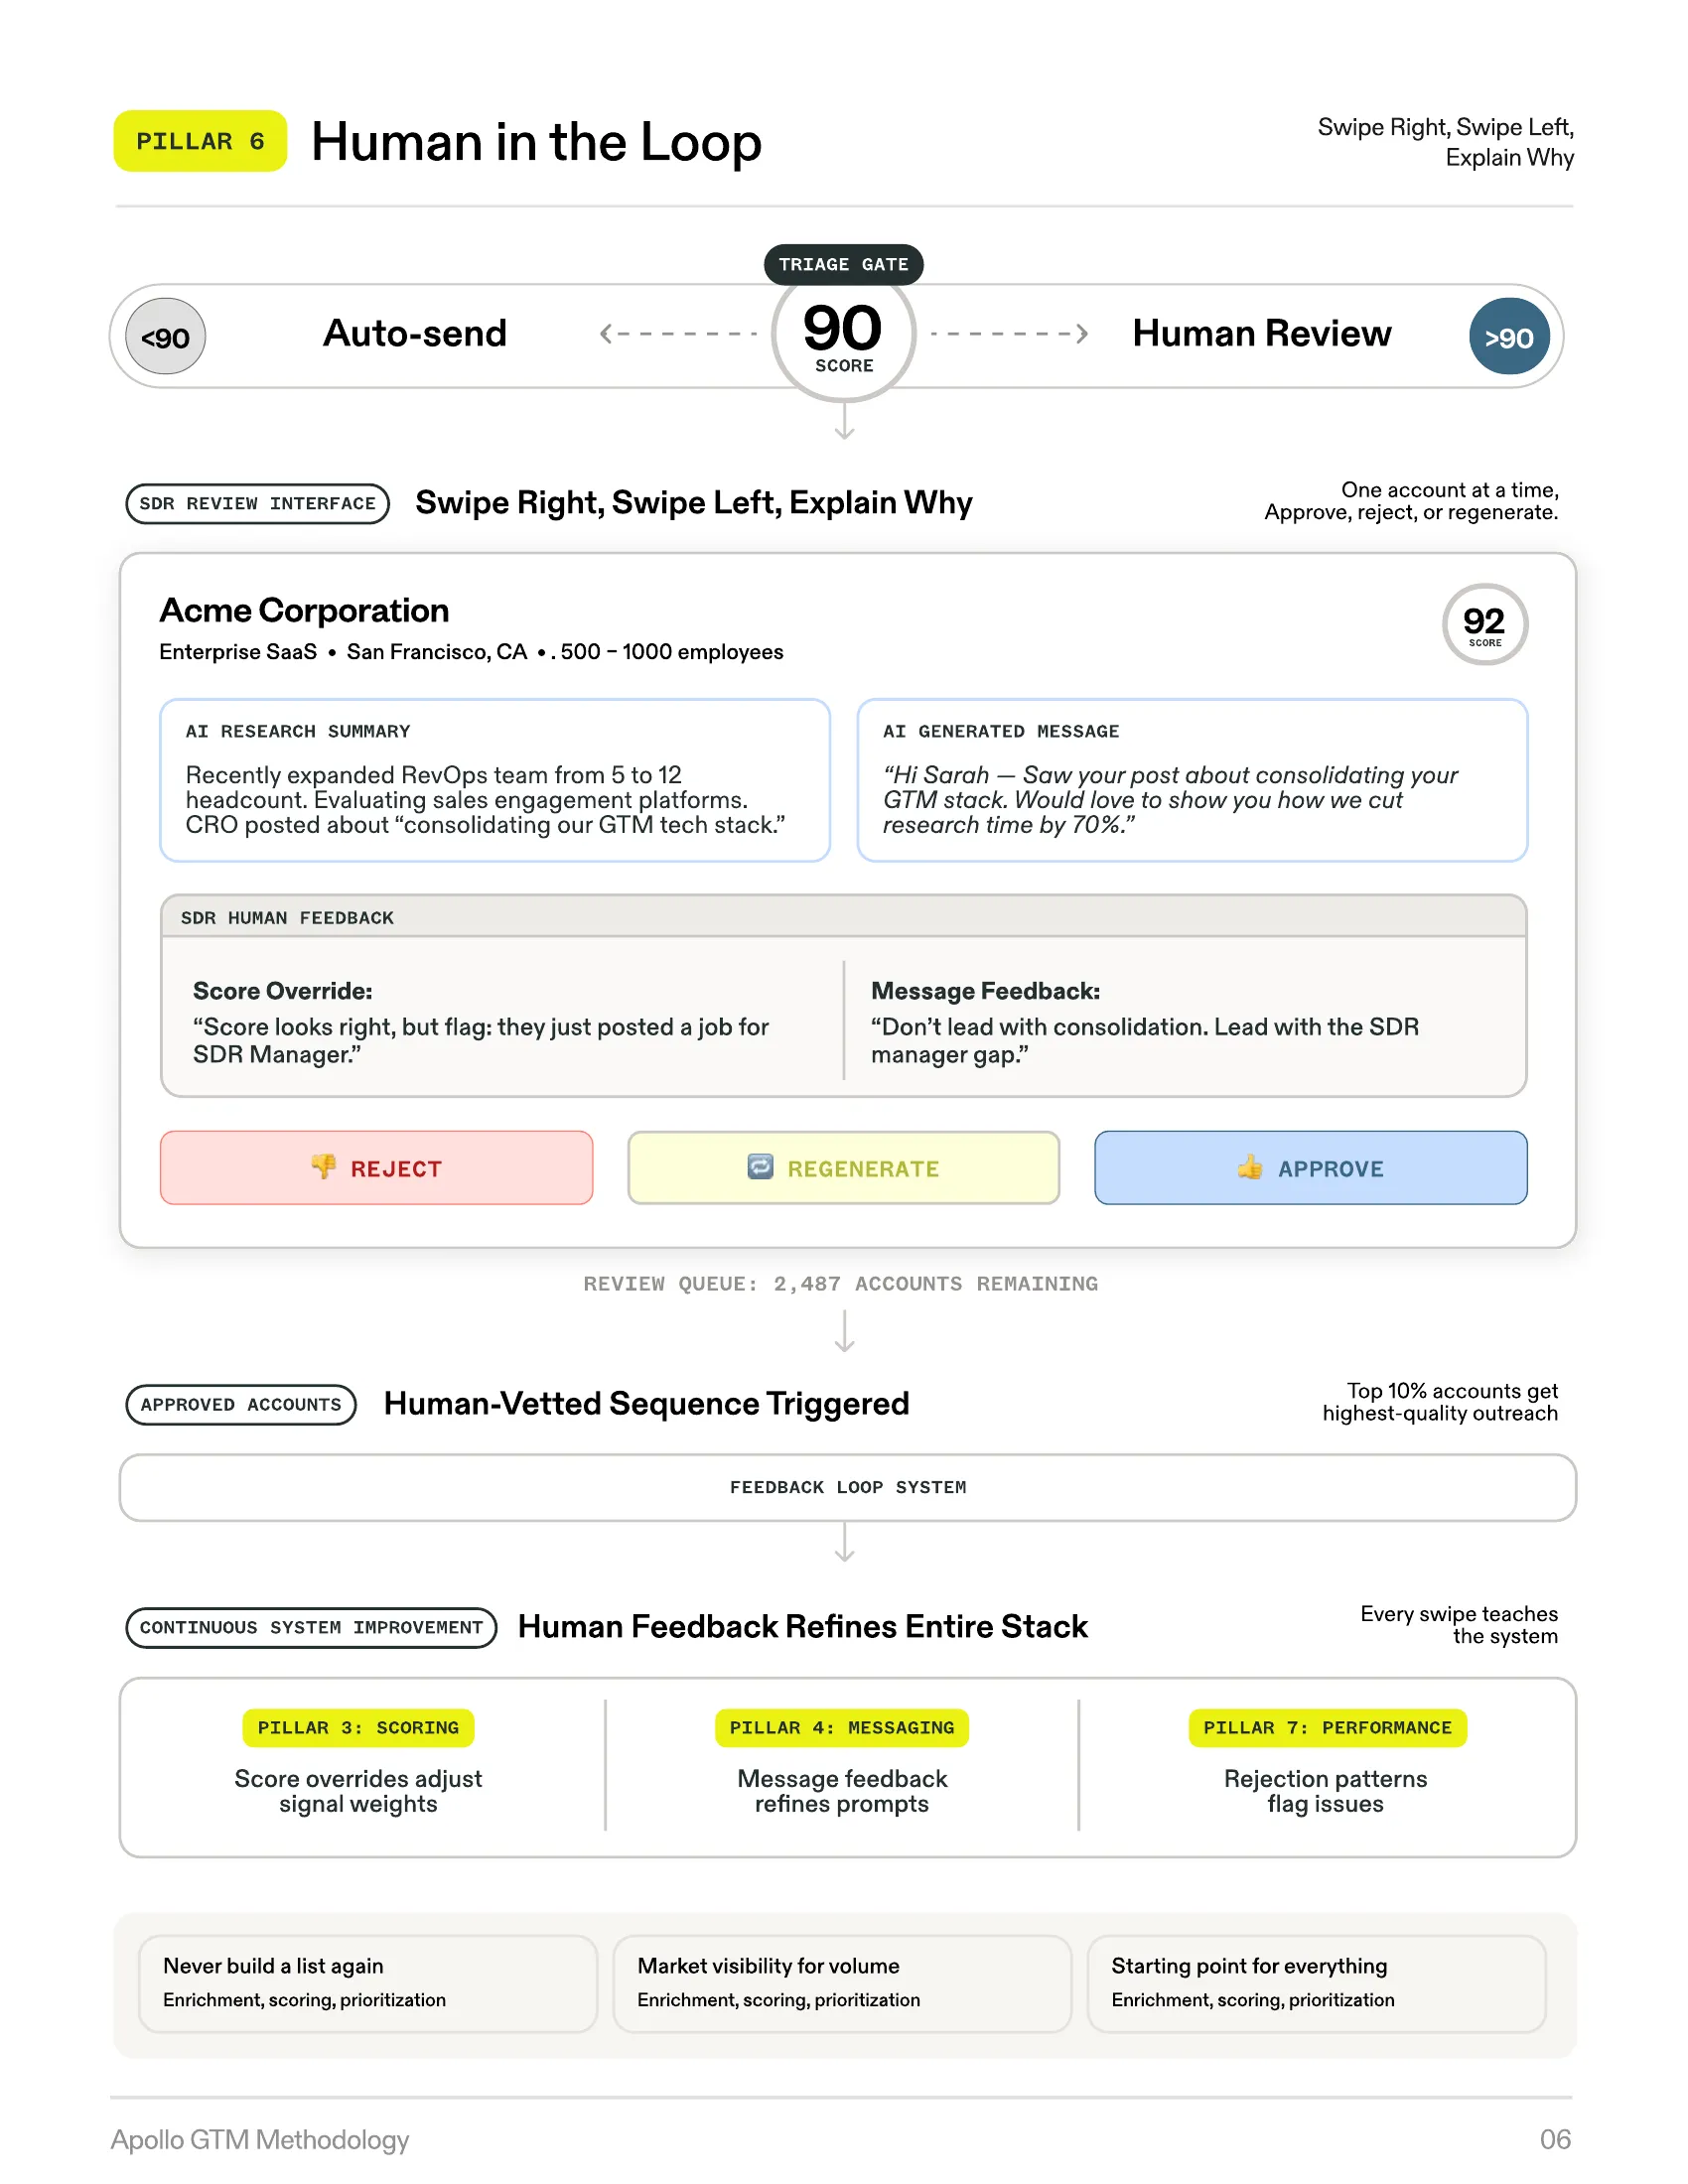
Triage Gate: Score ≥ 90 = Human Path
The 90/10 split operates on a simple threshold. Accounts scoring below 90 enter fully automated sequences. Accounts scoring 90 or above route to a human review interface.
The “Swipe Right, Swipe Left” Interface
SDRs are presented with pre-researched, pre-scored, pre-written outreach for each high-value account. For each one, they see the AI research summary, the generated message, the score with its rationale, and feedback fields for corrections. The SDR takes one of three actions:
-
Reject the account
-
Regenerate the message with specific feedback
-
Approve it into the sequence
The Dual Value
| Value Type | Description |
|---|---|
| Immediate — Quality control | Every high-value account receives outreach vetted by a human expert. AI hallucinations are caught, messaging is refined. |
| Long-term — System improvement | Every piece of human feedback is structured data. Score overrides refine Pillar 3 weights, message edits refine Pillar 4 prompts. |
SDRs are not reviewing emails — they are training the system. Every annotation makes the next batch more accurate in a continuous improvement loop.
SDR Role Evolution
The methodology redefines the SDR function from manual labor to three strategic roles:
-
AI & Data Annotator — reviewing and correcting AI outputs
-
Strategic Reviewer — applying domain expertise where it has the most impact
-
System Trainer — generating structured feedback that improves AI accuracy
Monitoring Thresholds
| Signal | Meaning | Action |
|---|---|---|
| Override rate | SDRs consistently override AI scores | Re-evaluate signal weights or research prompts |
| Annotation accuracy | Quality of human feedback | Ensure training data is reliable |
| Message feedback patterns | Same correction appears repeatedly | Update base copywriting prompt |
Pillar 7: Reporting & Performance Optimization
 Source: Apollo · Built by Orchestra
Measure to Improve — The Self-Optimizing Flywheel
Campaign-based reporting is useless in this system because there are no campaigns. “The healthcare campaign got a 3% reply rate” does not tell you why it got 3%, which signals predicted success, or what to change.
The Method
Pillar 7 replaces campaign metrics with signal-level performance analysis — measuring which individual signals correlate with positive outcomes and adjusting the system accordingly.
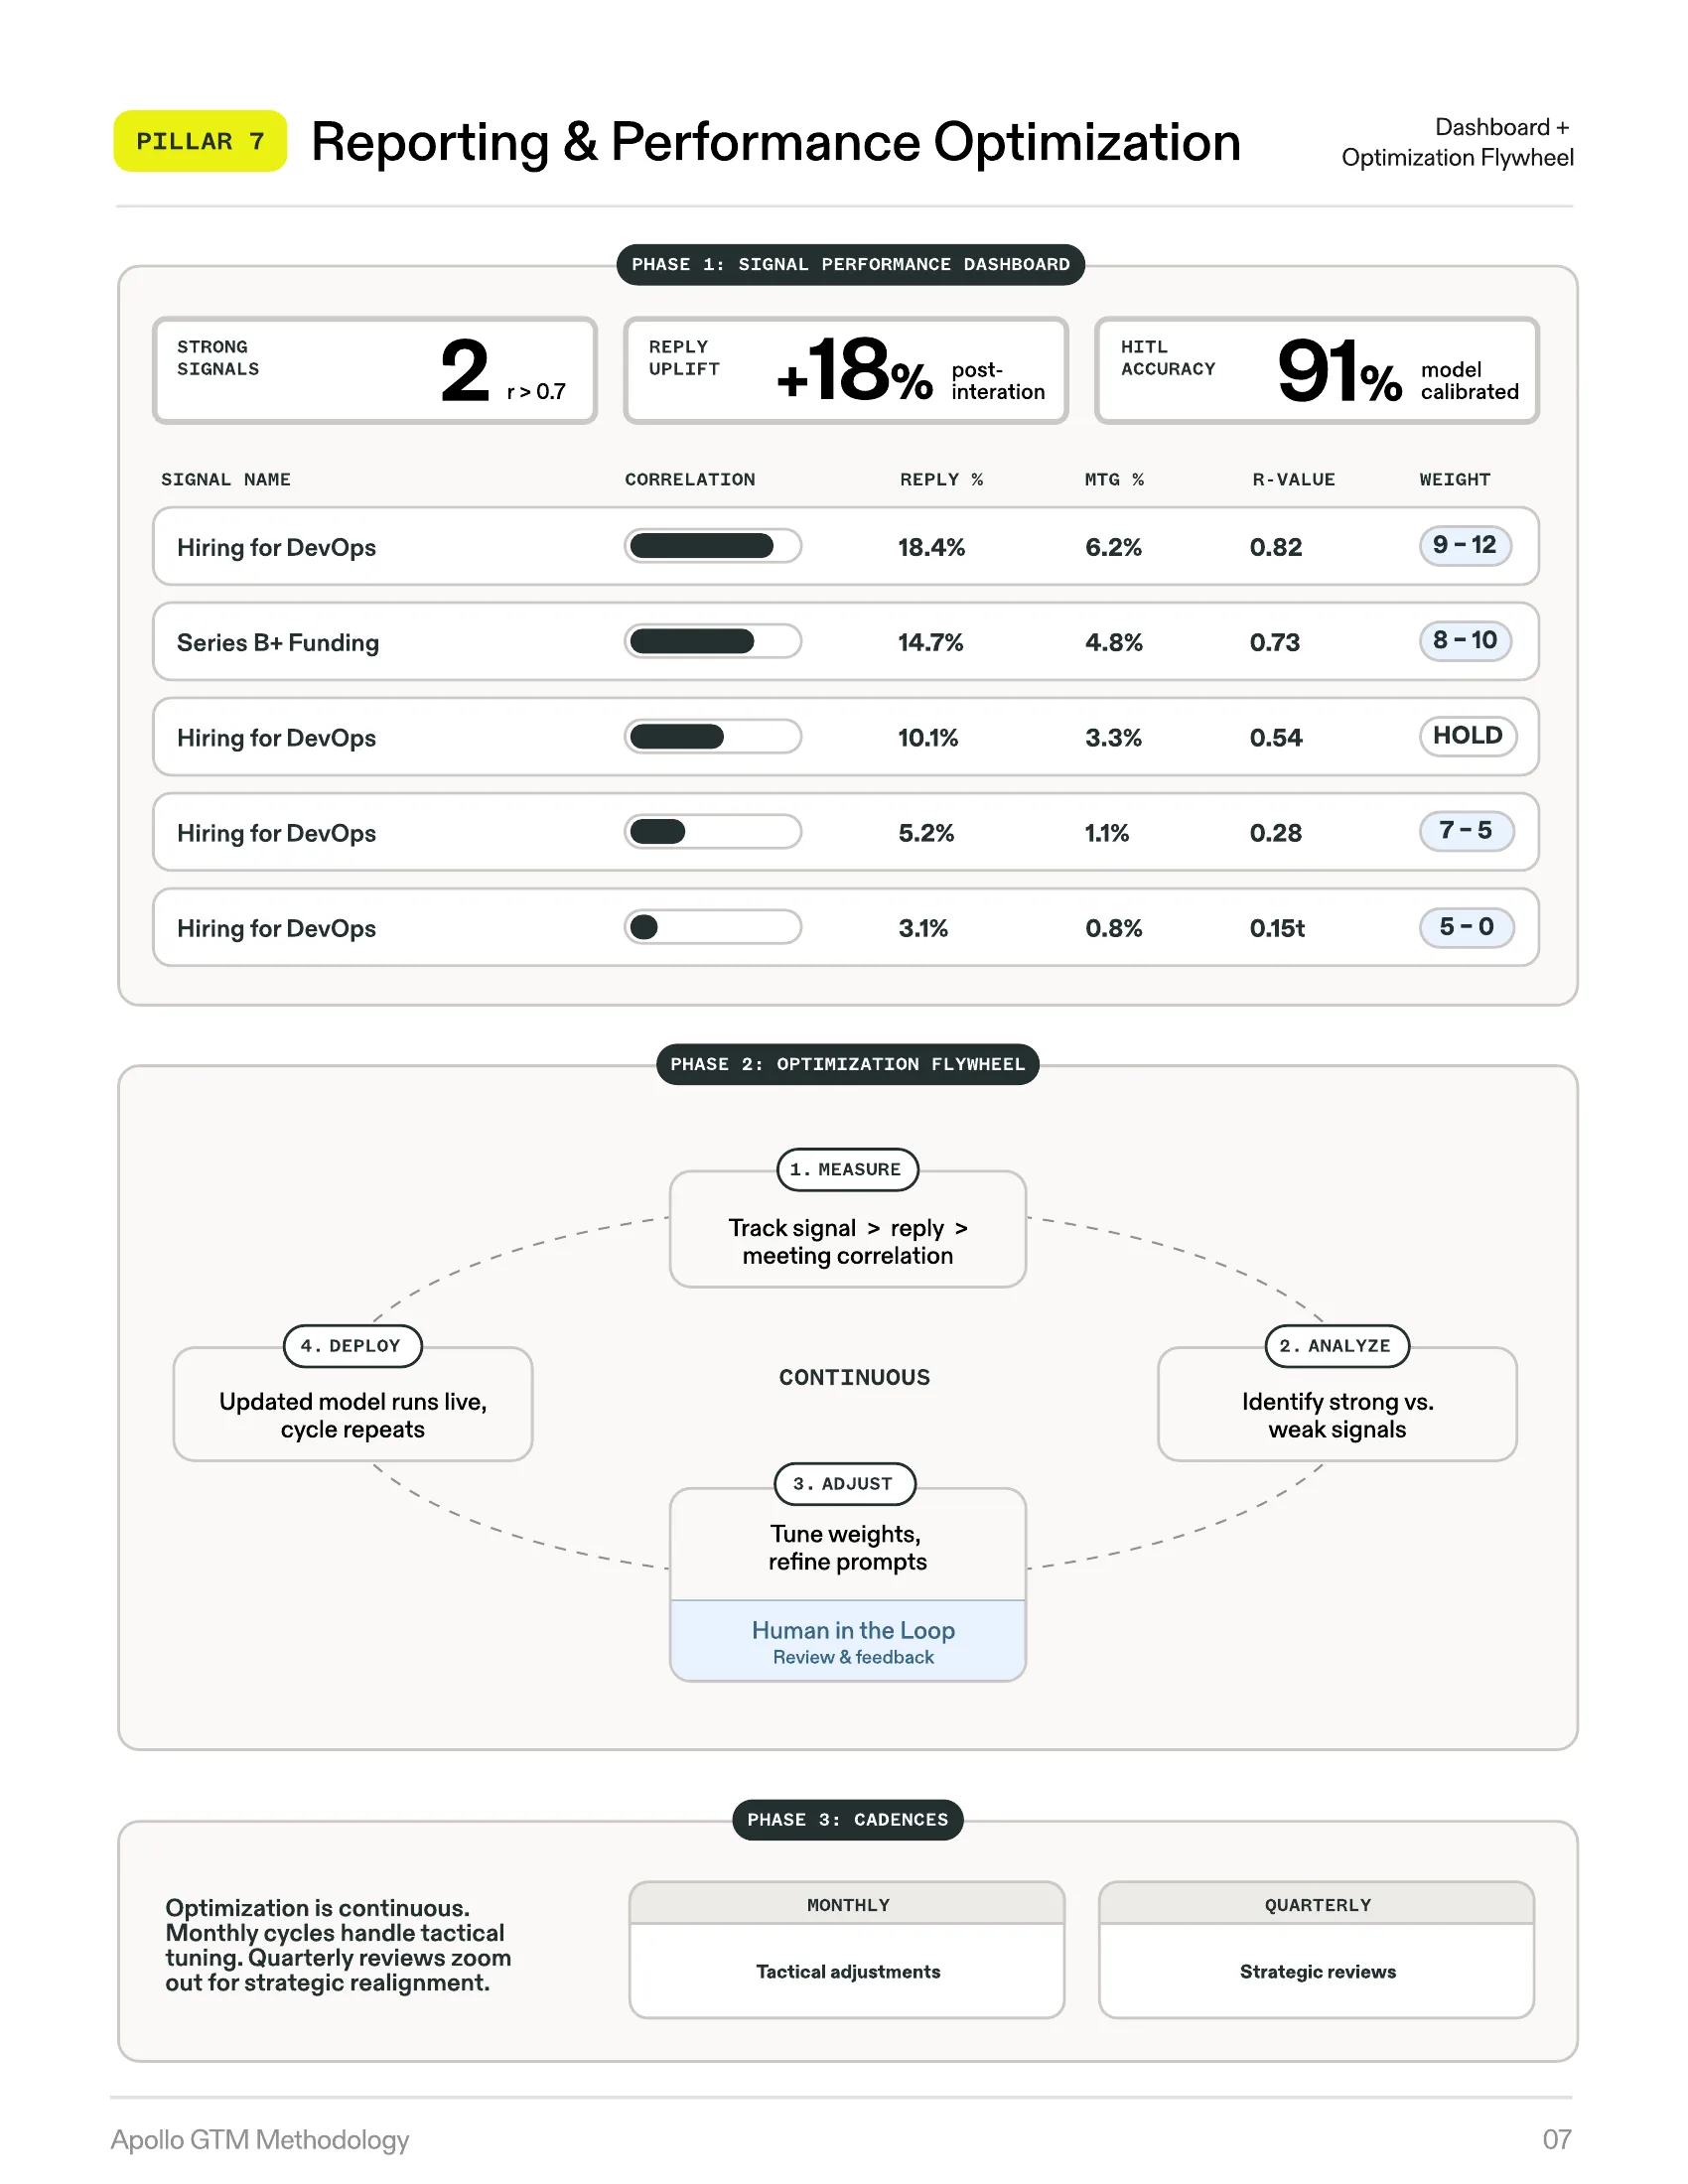
Signal Performance Dashboard
Every signal in the signal table is tracked against business outcomes (meetings booked, deals created, revenue influenced). The core metric is correlation analysis — measuring the statistical relationship between each signal and conversion.
Strong correlation (r > 0.7): The signal predicts success — increase its weight. Weak correlation (r < 0.5): The signal is not predictive — decrease its weight or remove it entirely.
The Optimization Flywheel
The system operates on a four-step continuous loop:
-
Measure — Track signal-to-outcome correlations
-
Analyze — Identify strong and weak signals
-
Adjust — Tune weights, refine prompts, update messaging guidelines
-
Deploy — Updated model immediately changes the priority queue and messaging
Two Cadences
| Cadence | Focus | Activities |
|---|---|---|
| Monthly (Tactical) | Prompt tuning & weight adjustments | Address underperforming signals, capitalize on strong ones |
| Quarterly (Strategic) | Full system review | Add new signals, remove dead ones, reassess TAM criteria, evaluate burn rate |
Feedback Loops to Every Pillar
-
→ Pillar 1: Low reply rates in a segment trigger TAM re-qualification
-
→ Pillar 2: Bounce rates above 5% trigger infrastructure adjustment
-
→ Pillar 3: Correlation analysis drives weight changes
-
→ Pillar 4: Reply sentiment identifies which messaging guidelines need revision
-
→ Pillar 5: Enrichment success rates highlight workflow issues
-
→ Pillar 6: HITL override rates indicate whether human review needs refinement
What This Produces
-
Signal weights that get more accurate over time
-
Messaging that improves with every send cycle
-
Infrastructure that adjusts to real deliverability conditions
-
Institutional memory — the accumulated learning about what predicts success, captured in signal weights, messaging guidelines, and scoring models that compound across quarters
The Closed-Loop System
The seven pillars are not a checklist. They are a closed-loop system where each pillar feeds the others.
Pillar 1 creates the market. Pillar 2 sizes the infrastructure to serve it. Pillar 3 builds the intelligence layer. Pillar 4 turns intelligence into communication. Pillar 5 implements the pipeline. Pillar 6 adds human precision. Pillar 7 measures everything and feeds corrections back to Pillars 1 through 6.
Remove any single pillar and the system degrades. A unified TAM without scoring is a big list with no priority. Scoring without messaging intelligence produces prioritized accounts with generic outreach. And all of it without reporting means no learning, no improvement, no compounding advantage.
Three Paradigm Shifts
1. From Campaigns to Signals
The campaign — a time-boxed, list-based outreach effort — is the default unit of GTM execution at most companies, and the methodology eliminates it entirely. Targeting logic is expressed as signal weights.
2. From Scattered Lists to Unified TAM
One comprehensive market definition, one scoring model applied to every account, and one priority queue that self-orders. Every GTM activity references the same source of truth.
3. From Manual Execution to AI + Human Orchestration
SDRs do not build lists. They do not research companies. They do not write emails. The system handles all of that. SDRs review the top 10% — the highest-value outputs — and their corrections train the system to be more accurate.
Before and After
| Dimension | Traditional GTM | Apollo GTME Methodology |
|---|---|---|
| Market Definition | Multiple fragmented lists per rep. Nobody knows total market size. | One unified, AI-qualified TAM. Single source of truth. |
| Targeting Logic | Campaign-driven. Time-boxed. Learning dies when campaign ends. | Signal-driven. Continuous. Learning compounds. |
| Prioritization | Gut feel, tribal knowledge, or basic lead scoring. | Composite scoring across fit + timing signals. Self-updating. |
| Messaging | Templates with merge tags, or manual personalization that doesn’t scale. | AI-generated from signal data. Account-specific. Thread-aware. |
| Infrastructure | ”Ten mailboxes sounds right.” Volume guessed. | Infrastructure derived from TAM math. Every mailbox tied to market size. |
| Human Involvement | Review everything (bottleneck) or review nothing (risk). | Top 10% reviewed. Bottom 90% automated. Every review trains the system. |
| Reporting | Campaign-level metrics. No signal-level attribution. | Signal-level correlation analysis. Weights adjust automatically. |
| Quarter Transitions | Start over. New campaigns, new lists, new metrics. | Continuous. The system carries forward everything it learned. |
Business Impact
| Area | Impact |
|---|---|
| Pipeline Economics | Account-level AI research runs once, amortizes across all contacts. Per-meeting cost drops as the system matures. |
| Time to First Meeting | Traditional ramp: 4-6 weeks. Methodology ramp: 2-3 weeks (warmup), then qualified outreach from day one. |
| Rep Productivity | SDRs shift from daily list-building to strategic review. Same team covers significantly more market. |
| Retention Mechanics | Warm infrastructure creates natural switching costs. Signal table represents months of accumulated intelligence. |
| Compounding Returns | Month 1: outreach. Month 3: tuned weights. Month 6: refined messaging. Month 12: institutional memory no individual rep could carry. |
Implementation
The methodology is designed to be implemented incrementally:
-
Start with Pillar 1. Build the unified TAM — a one-time foundational investment that creates the market definition everything else depends on.
-
Add Pillar 2. Size infrastructure to the TAM. Run the backward calculator. Provision mailboxes and domains with appropriate buffer.
-
Build Pillar 3. Create the signal table with leadership. Align on what signals matter, how they are weighted, and what outcomes look like.
-
Layer in Pillars 4 and 5. Implement messaging intelligence and data orchestration together — they are deeply interdependent.
-
Activate Pillar 6. Once the system is producing outputs, introduce human-in-the-loop review for the top 10%.
-
Turn on Pillar 7. After one full execution cycle (typically one month), begin measuring signal-to-outcome correlations.
The full system typically reaches operational maturity within 90 days. Each subsequent cycle gets more accurate, more efficient, and more predictive.
About This Work
The Apollo GTME Methodology was developed by Orchestra GTM in direct partnership with Apollo.io’s GTM Engineering organization.
Orchestra GTM (orchestragtm.com) is a GTM consulting firm that specializes in designing and implementing systematic go-to-market architectures for B2B revenue teams. We built this methodology from real customer implementations — not theory, not best practices borrowed from blog posts, but from the specific challenges that emerge when companies try to scale outbound beyond brute force.
Apollo.io provides the platform infrastructure that makes this methodology operational — the database for TAM creation, the AI Power-Ups for qualification and research, the workflow engine for orchestration, the mailbox infrastructure for execution, and the analytics for reporting.
Strategy in, execution out — nothing lost in translation.
What Comes Next
If you are running outbound today — with scattered lists, generic messaging, and campaign metrics that reset every quarter — the gap between that and a self-optimizing system widens every month you wait.
Back to Blog